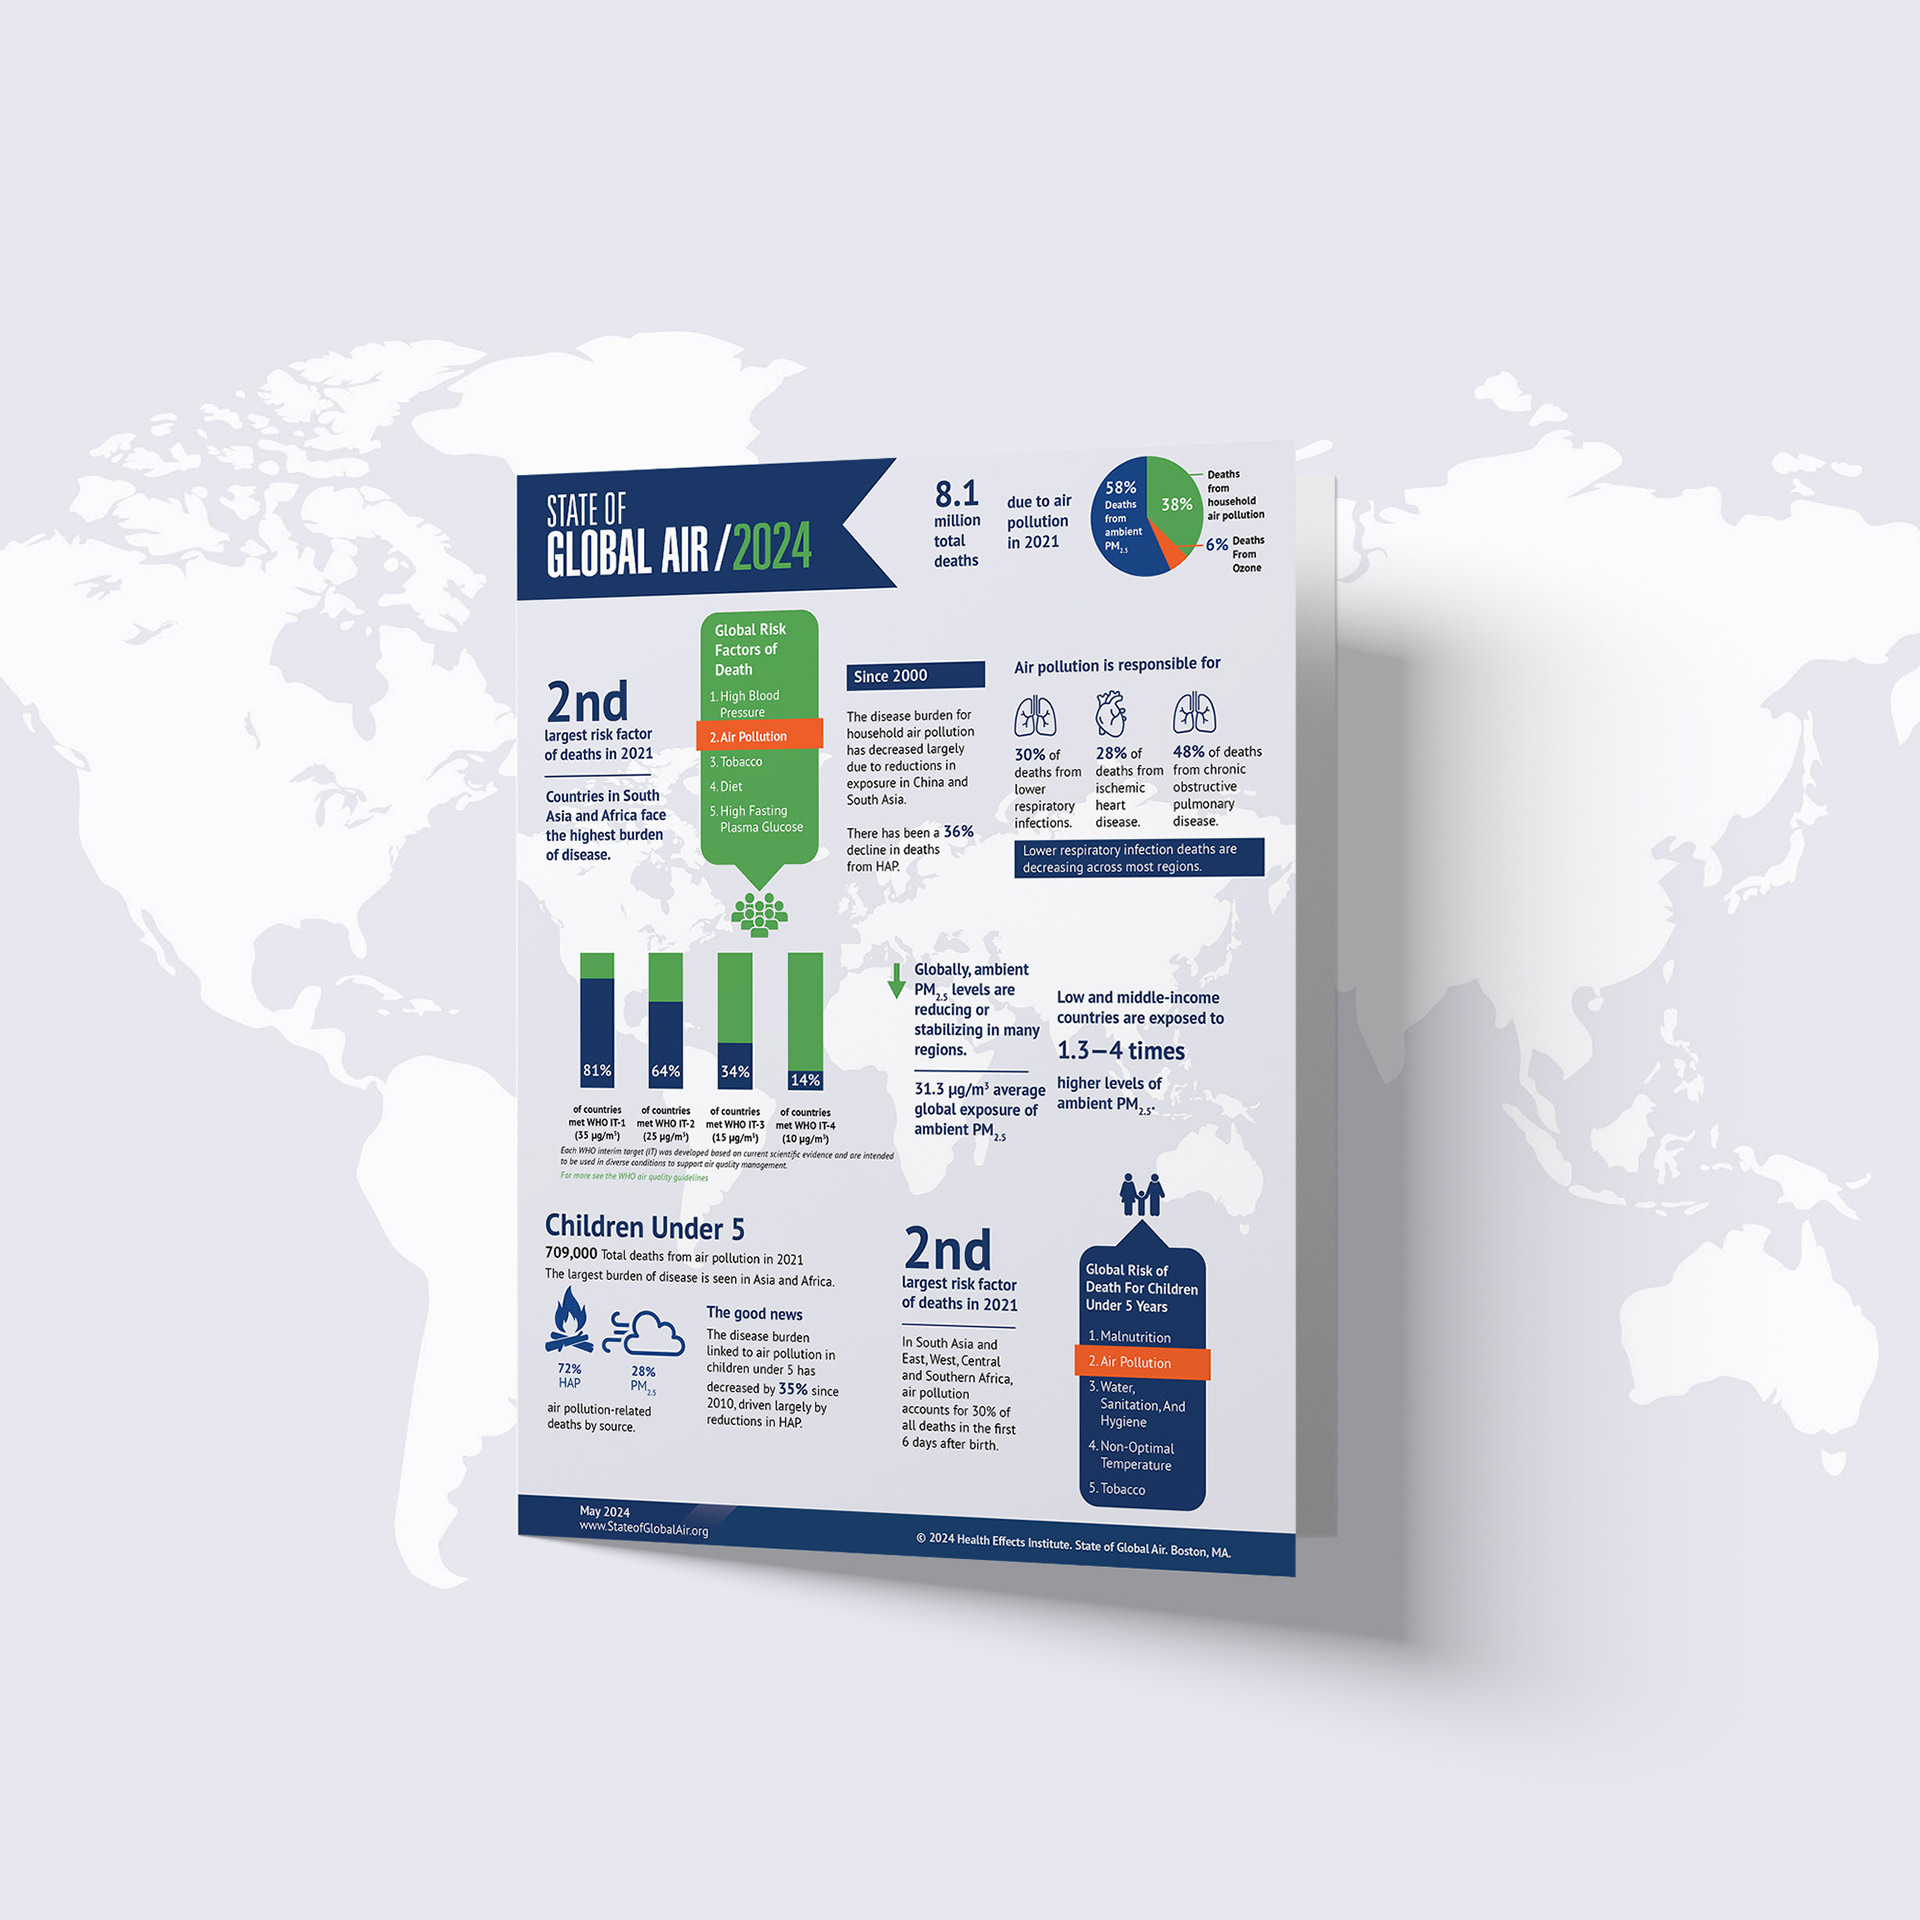
This project involved the design of a supplemental infographic publication supporting the State of Global Air 2024 report, produced by Health Effects Institute (HEI) in partnership with UNICEF. The report provides a comprehensive global analysis of air quality and its health impacts, including data on mortality, disease burden, and long-term trends across more than 200 countries and regions.
While the full report was developed separately, I was commissioned to design a standalone infographic that distilled key findings into a clear, accessible visual format. The goal was to translate complex global data into a concise, high-impact piece that could be easily shared, understood, and referenced alongside the larger publication.
Drawing on my background in print and editorial design, the infographic was developed using a data-first approach—integrating charts, typographic hierarchy, and visual pacing to support comprehension. The design adheres closely to HEI’s established color palette and visual standards while introducing dynamic composition and clarity through vector-based graphics.
The work was executed primarily in Adobe Illustrator, resulting in high-quality, scalable vector artwork suitable for both digital and print use. This project highlights my ability to synthesize dense environmental data into compelling visual communication that supports public understanding, research dissemination, and advocacy.
Tools: Adobe Illustrator
Deliverable: Supplemental air quality infographic
Focus: Information design, data visualization, environmental communication
Deliverable: Supplemental air quality infographic
Focus: Information design, data visualization, environmental communication